![]() This post is older than a year. Consider some information might not be accurate anymore.
This post is older than a year. Consider some information might not be accurate anymore. ![]()
Used: elasticsearch v5.4.1
TL,DR (Too long, Don’t read.). If you have a dedicated monitoring cluster for your Elasticsearch clusters, you should at least monitor the memory usage of each node. This is very helpful. Instead of fetching the data from the cluster within, we query the monitoring cluster remotely. This watch was created on Elasticsearch with X-Pack v5.4.3. Pay attention, that some values are tweaked and not realistic for production scenarios. The interval for instance is set to 6 hours, since we will execute this watch manually. We also choose 60% as threshold. 75% or 80% would be more realistic for warning scenarios.
Following watch was developed in conjunction with our Elasticsearch Support Engineers. They provided the groundwork, since painless is not painless IMHO. I know this is very opinionated, you can take me on Twitter or mail me for that. We took the example from Elasticsearch Watcher (Version 2.3) and adjusted it to the new dedicated monitoring cluster.
- The Watcher Skeleton
- Using Metadata
- Schedule Trigger
- Remote Input
- Condition Trigger
- Action - Notification
The Watcher Skeleton
PUT _xpack/watcher/watch/mem-watch
{
  "metadata": {
    "threshold": 60
  },
  "trigger": {
    "schedule": {
      "interval": "6h"
    }
  },
  "input": {
    "http": {
      "request": {
        "scheme": "http",
        "host": "your-monitoring-server",
        "port": 9200,
        "method": "get",
        "path": ".monitoring-es-2-*/node_stats/_search",
        "params": {},
        "headers": {},
        "body": """{"size": 0, "query":{"bool":{"filter": [{"range":{"timestamp":{"from": "now-10m", "to": "now", "include_lower": true, "include_upper": true, "boost": 1}}}], "disable_coord": false, "adjust_pure_negative": true, "boost": 1}}, "aggregations":{"minutes":{"date_histogram":{"field": "timestamp", "interval": "minute", "offset": 0, "order":{"_key": "asc"}, "keyed": false, "min_doc_count": 0}, "aggregations":{"nodes":{"terms":{"field": "source_node.name", "size": 10, "min_doc_count": 1, "shard_min_doc_count": 0, "show_term_doc_count_error": false, "order": [{"memory": "desc"},{"_term": "asc"}]}, "aggregations":{"memory":{"avg":{"field": "node_stats.jvm.mem.heap_used_percent"}}}}}}}, "ext":{}}"""
      }
    }
  },
  "condition": {
    "script": {
       "inline": "if (ctx.payload.aggregations.minutes.buckets.size() == 0) return false; def latest = ctx.payload.aggregations.minutes.buckets[-1]; def node = latest.nodes.buckets[0]; return node?.memory?.value >= ctx.metadata.threshold;"
    }
  },
  "actions": {
    "send_mem_warning": {
      "transform": {
        "script": {
          "lang": "painless",
          "inline": "def latest = ctx.payload.aggregations.minutes.buckets[-1]; return latest.nodes.buckets.stream().filter(item -> item.memory.value >= ctx.metadata.threshold).collect(Collectors.toList());"
        }
      },
      "email": {
        "profile": "standard",
        "from": "watcher@your-company.com",
        "reply_to": [
          "your-email@your-company.com"
        ],
        "to": [
          "le-mapper@cinhtau.net"
        ],
        "cc": [
          "my-buddies@your-company.com"
        ],
        "subject": "Watcher Notification - HIGH MEMORY USAGE",
        "body": {
          "html": {
            "stored": "mem-watch-warning",
            "lang": "mustache"
          }
        }
      }
    }
  }
}
Using Metadata
Instead of hardcoding the threshold of 60 use the metadata capability of Elasticsearch Watcher v5.4.
Put this json before trigger:
"metadata": {
  "threshold" : 60
}
Replace the literal 60 with ctx.metadata.threshold.
"inline": "if (ctx.payload.aggregations.minutes.buckets.size() == 0) return false; def latest = ctx.payload.aggregations.minutes.buckets[-1]; def node = latest.nodes.buckets[0]; return node?.memory?.value >= ctx.metadata.threshold;"
Schedule Trigger
The trigger section defines how often the watch shall be executed. Below the interval is five minutes.
"trigger": {
    "schedule": {
      "interval": "5m"
    }
}
Remote Input
Since the input is a http request to the monitoring server, the path is the REST endpoint
- index pattern →
.monitoring-es-2-*(the x-pack monitoring data) - document type →
nodes_stats - operation →
_search
The tricky part is the body, that contains the JSON request body. This is Elasticsearch Query DSL. In short, the watch looks back in the last 5 minutes and aggregates the average memory usage for each Elasticsearch node. You could restrict it only to data nodes, but why? Doesn’t hurt to monitor the master and client nodes. As you can see it is quite ugly when minified. You should develop this part always separately and in a readable format.
A great help are these tools:
- Minifier
- and JSON Escape.
You should always test the query first, before you can take on watcher.
Condition Trigger
Based on a condition an action is executed. This complicated expression is in fact just a comparison and returns the average value of the mem usage of each elasticsearch node.
"condition": {
      "script": {
      "inline": "if (ctx.payload.aggregations.minutes.buckets.size() == 0) return false; def latest = ctx.payload.aggregations.minutes.buckets[-1]; def node = latest.nodes.buckets[0]; return node?.memory?.value >= ctx.metadata.threshold;",
      "lang": "painless"
    }
}
Action - Notification
The body.html message part is empty, since I kind of like to have a separate mustache template for that.
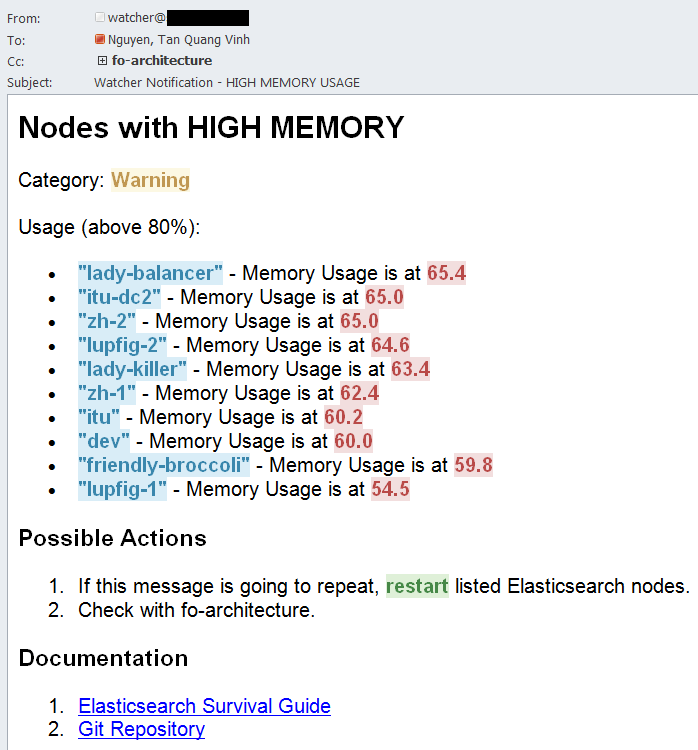
This simple mustache template will do. It will list every node name and its aggregated value. _value is a collection which were created by the painless script in the action body.
<h2>Nodes with HIGH MEMORY</h2>

Usage (above 60%):
<ul>
{{#ctx.payload._value}}
<li>"{{key}}" - Memory Usage is at {{memory.value}}</li>
{{/ctx.payload._value}}
</ul>
Minify above template to store it into elasticsearch.
POST _scripts/mem-watch-warning
{
  "script": {
    "lang": "mustache",
    "code": "<h2>Nodes with HIGH MEMORY</h2>Usage (above 60%):<ul>{{#ctx.payload._value}}<li>\"{{key}}\" - Memory Usage is at {{memory.value}}</li>{{/ctx.payload._value}}</ul>"
  }
}
In the action section of the watcher reference to the stored script.
 "actions": {
    "send_mem_warning": {
      "transform": {
        "script": {
          "lang": "painless",
          "inline": "def latest = ctx.payload.aggregations.minutes.buckets[-1]; return latest.nodes.buckets.stream().filter(item -> item.memory.value >= ctx.metadata.threshold).collect(Collectors.toList());"
        }
      },
      "email": {
        "profile": "standard",
        "from": "watcher@cinhtau.net",
        "to": [
          "le-mapper@cinhtau.net"
        ],
        "subject": "Watcher Notification - HIGH MEMORY USAGE",
        "body": {
          "html": {
            "stored": "mem-watch-warning"
          }
        }
      }
    }
  }
If we want to change the notification message, I don’t have to touch the watcher anymore. So I can alter the look and feel as I like.
You can see the outcome, by executing the watch manually, instead waiting for the trigger.
POST _xpack/watcher/watch/mem-watch/_execute
If you have set xpack.notification.email.html.sanitization.enabled: false in the elasticsearch.yml you can have colorful warnings.