![]() This post is older than a year. Consider some information might not be accurate anymore.
This post is older than a year. Consider some information might not be accurate anymore. ![]()
Watcher is a commercial plugin for alerting based on elasticsearch documents. The required knowledge could be overwhelming, but is rather straightforward and pretty simple after understanding the fundamental concepts. This post will give you a simple watch definition to grasp the concept. If you have application logs and store them into elasticsearch, you want to be alerted if a log entry with log level ERROR is reported. Let’s do this.
Preconditions
This demo requires a simple elasticsearch instance with the watcher plugin installed. A fresh installation grants you a 30 day trial period for watcher. Just take my elasticsearch docker image for the demo. The run command disables the security module shield, so you can use elasticsearch without user authentication.
tan@omega:~$ mkdir -p /tmp/data /tmp/logs
tan@omega:~$ sudo docker run -it --net=host \
 -v /tmp/data:/elasticsearch/data \
 -v /tmp/logs:/elasticsearch/logs \
  cinhtau/elasticsearch:latest \
 -Des.shield.enabled=false
Test data
I will create a elasticsearch document that represents a log entry indicating an application error.
Setup test index
First of all we create a test index, for storing the elasticsearch documents or log entries. For each event we enable the timestamp to be automatically set. Following commands are RESTful http requests done with Sense - a Kibana UI plugin for the elasticsearch REST API (see Screenshot). Use curl if no Sense is available. (Update: Sense is now Kibana Console with x-pack rebranding)
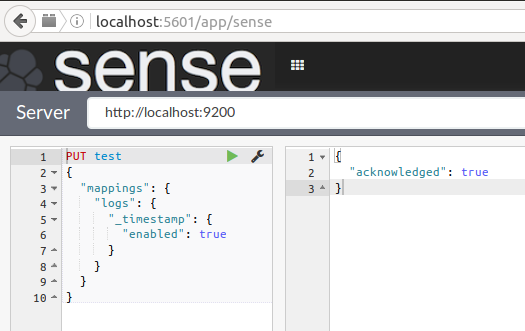
PUT test
{
  "mappings": {
    "logs": {
      "_timestamp": {
        "enabled": true
      }
    }
  }
}
Create test log entry
We create a new document (log entry), the document type is logs :-) . A unique message id will be given by elasticsearch if we don’t provide one. In this case the id 1 is assigned.
POST test/logs/1
{
  "path": "/var/log/myapp.log",
  "host": "omega",
  "application": "p2-fear",
  "environment": "prd",
  "level": "ERROR",
  "thread": "MSC service thread 1-57",
  "logmessage": "MessageQueue is full.",
  "seq": 572431,
  "exchangeId": "4711",
  "transactionId": "DHF720l0S",
  "tags": [
    "critical", "infrastructure"
  ]
}
Result
  "_index": "test",
  "_type": "logs",
  "_id": "1",
  "_version": 1,
  "_shards": {
    "total": 2,
    "successful": 1,
    "failed": 0
  },
  "created": true
}
Create a watch definition
The elastic source pretty much sums it up:
At a high-level, a typical watch is built from four simple building blocks:
- Schedule - Define the schedule on which to trigger the query and check the condition.
- Query - Specify the query to run as input to the condition. Watcher supports the full Elasticsearch query language, including aggregations.
- Condition - Define your condition to determine whether to execute the actions. You can use simple conditions (always true), or use scripting for more sophisticated scenarios.
- Actions - Define one or more actions, such as sending email, pushing data to 3rd party systems via webhook, or indexing the results of your query.
Schedule
The schedule is every 15 minutes.
"trigger" : {
  "schedule" : { "interval" : "15m" }
}
Design the query
The hardest part of the watcher definition is to build the search query.
GET test/_search
{
  "query": {
    "bool": {
      "must": [
        { "match": { "application": "p2-fear" }},
        { "match": { "level": "ERROR" }},
        { "range": { "_timestamp": {
            "gte": "now-15m",
            "lte": "now"}}}
      ]
    }
  }
}
The most important definition is the time range, it should be identical to your watch schedule. You want to check in the last 15 minutes if there was an error. Otherwise you will report the same errors again. Executing the search it should give you one hit ![]() . As a side note, if you are dealing with logs send by logstash the
. As a side note, if you are dealing with logs send by logstash the _timestamp field is @timestamp. :-o Adapt your search query to that, if it is the case!
  "took": 23,
  "timed_out": false,
  "_shards": {
    "total": 5,
    "successful": 5,
    "failed": 0
  },
  "hits": {
    "total": 1,
    "max_score": 1.0701059,
    "hits": [
      {
        "_index": "test",
        "_type": "logs",
        "_id": "1",
        "_score": 1.0701059,
        "_timestamp": 1473102364442,
        "_source": {
          "path": "/var/log/myapp.log",
          "host": "omega",
          "application": "p2-fear",
          "environment": "prd",
          "level": "ERROR",
          "thread": "MSC service thread 1-57",
          "logmessage": "MessageQueue is full.",
          "seq": 572431,
          "exchangeId": "4711",
          "transactionId": "DHF720l0S",
          "tags": [
            "critical",
            "infrastructure"
          ]
        }
      }
    ]
  }
}
So the input definition looks like this:
"input" : {
  "search" : {
    "request" : {
      "indices" : [ "logs" ],
      "body" : {
        "query": {
          "bool": {
            "must": [
              { "match": { "application": "p2-fear" }},
              { "match": { "level": "ERROR" }},
              { "range": { "_timestamp": {
                  "gte": "now-15m",
                  "lte": "now"}}}]
          }
        }
      }
    }
  }
}
Watch Condition
The condition in the watch definition, defines under which circumstances an action should be executed. In our case, execute an action if the search results are greater than 0.
"condition" : {
  "compare" : { "ctx.payload.hits.total" : { "gt" : 0 }}
}
Action or Alerting
Our action is an email notification. This assumes you have configured a smtp account in the elasticsearch.yml for watcher. The action is straightforward. An action named email_users is defined. A HTML mail is composed. Using HTML in JSON needs escapes of special characters.
"actions" : {
  "email_users" : {
    "email": {
      "to": "'Jason Bourne <jason.bourne@example.com>'",
      "subject": " executed",
      "body": {
        "html": "<\/b> executed with  hits"
      }
    }
  }
}
Complete Watch Definition
The complete defintion looks like this. Pay attention to replace a valid mail address.
PUT /_watcher/watch/log_error_watch
{
  "trigger" : {
    "schedule" : { "interval" : "15m" }
  },
  "input" : {
    "search" : {
      "request" : {
        "indices" : [ "logs" ],
        "body" : {
          "query": {
            "bool": {
              "must": [
                { "match": { "application": "p2-fear" }},
                { "match": { "level": "ERROR" }},
                { "range": { "_timestamp": {
                    "gte": "now-15m",
                    "lte": "now"}}}
              ]
            }
          }
        }
      }
    }
  },
  "actions" : {
    "email_users" : {
      "email": {
        "to": "'Jason Bourne'",
        "subject": " executed",
        "body": {
          "html": "<\/b> executed with  hits"
        }
      }
    }
  }
}
Administering Watch Definition
List all watch ids
GET .watches/_search
{
  "fields" : [],
  "query" : {"match_all" : { } }
}
The watch statistics itself can be queried with:
GET /_watcher/watch/log_error_watch
Since I haven’t configured an email account, an IllegalStateException is raised. But the interesting part when the watch was executed and if the conditions were met.
  "found": true,
  "_id": "log_error_watch",
  "_status": {
    "version": 2,
    "state": {
      "active": true,
      "timestamp": "2016-09-05T19:26:59.421Z"
    },
    "last_checked": "2016-09-05T19:42:00.182Z",
    "last_met_condition": "2016-09-05T19:42:00.182Z",
    "actions": {
      "email_users": {
        "ack": {
          "timestamp": "2016-09-05T19:26:59.421Z",
          "state": "awaits_successful_execution"
        },
        "last_execution": {
          "timestamp": "2016-09-05T19:42:00.182Z",
          "successful": false,
          "reason": "IllegalStateException[cannot find default email account as no accounts have been configured]"
        }
      }
    }
  }
..
To delete the watch:
DELETE /_watcher/watch/log_error_watch
