![]() This post is older than a year. Consider some information might not be accurate anymore.
This post is older than a year. Consider some information might not be accurate anymore. ![]()
Google has an Open Source (Apache License 2.0) solution for instant monitoring docker containers, the Container Advisor (cAdvisor). It is a powerful simple solution, for instant monitoring. The drawback, it keeps no history. You may export the data to Elasticsearch, but keep in mind, it is an extra effort and not current post subject. I’m going to introduce you basic problems with docker in this post.
Intro
I did a little Docker container - Elasticsearch Curator (es-curator) - and wanted to know how much memory does it consume on the big machine. Therefore you might use docker stats. It might give you a very long list like this (output shortened):
CONTAINER           CPU %               MEM USAGE / LIMIT     MEM %               NET I/O               BLOCK I/O
0220fea60e6a        0.08%               720.9 MB / 134.3 GB   0.54%               54.06 MB / 45.96 MB   128.8 MB / 438.3 kB
..
dbfc1c6bf14a        0.22%               900.4 MB / 134.3 GB   0.67%               166.3 MB / 70.31 MB   152.8 MB / 25.99 MB
e21a72e127ed        0.95%               1.664 GB / 134.3 GB   1.24%               150.9 MB / 236.6 MB   158.3 MB / 39.27 MB
e62122b6c9f6        22.74%              8.224 GB / 8.59 GB    95.74%              0 B / 0 B             88.09 GB / 183.2 GB
Holy shit, I don’t know my container id, so therefore I need to look it up with docker ps | grep es-curator.
cAdvisor
Then I asked myself, there must be someone out there, who did already the monitoring job. That’s cAdvisor. Just run the docker run command and it works like that.
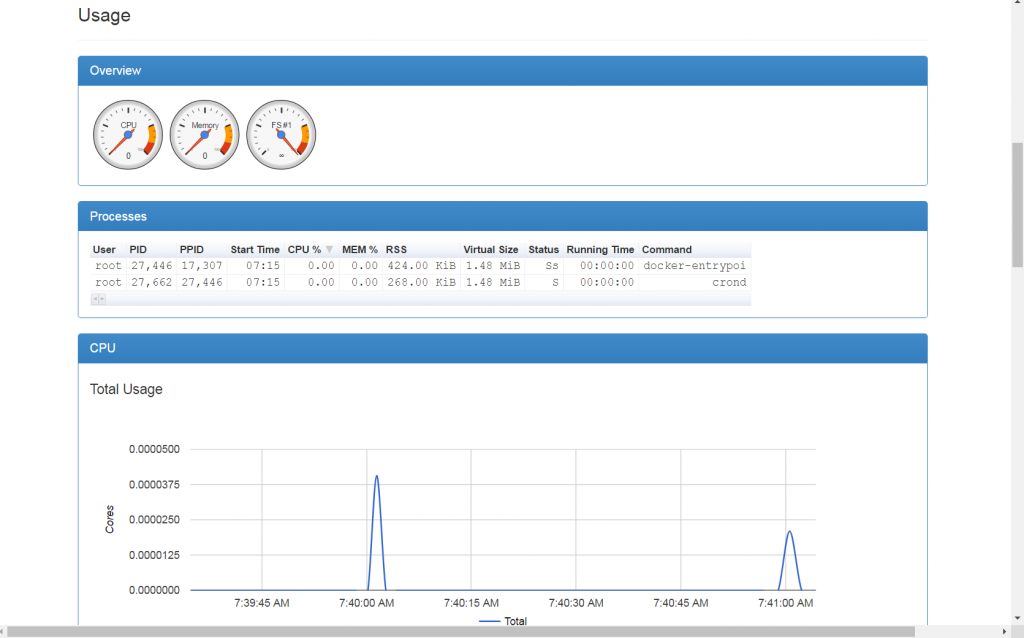
Overview
The overview page, gives you nice gauges: 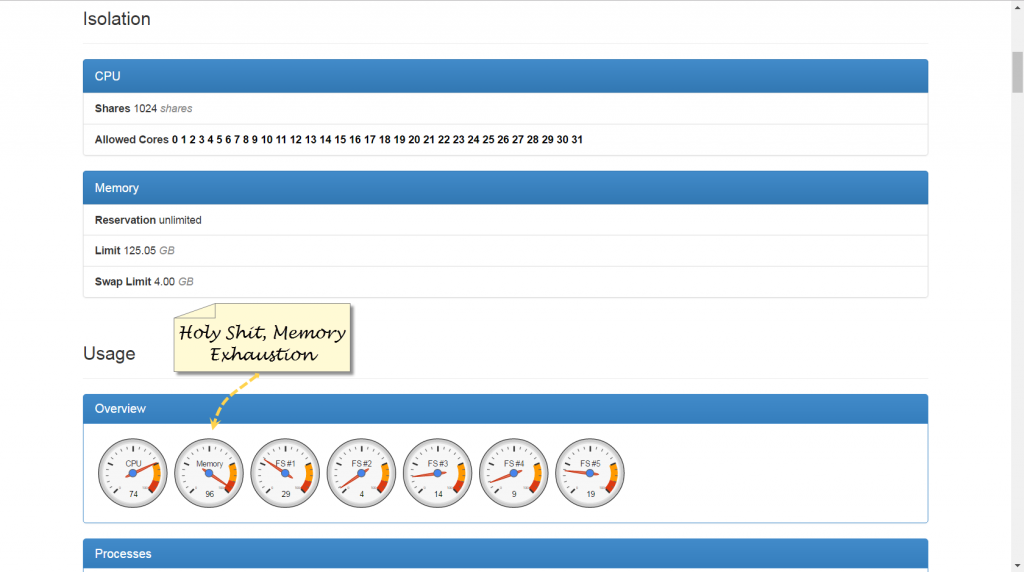
As you can see, Google Charts is behind the curtain, and a good indicator for problem areas.
Process Overview
If I do on my shell (output prettified), I can look up my process ids.
# docker top es-curator
UID      PID     PPID    C  STIME  TTY  TIME                CMD
root     27446   17307   0  07:15  ?    00:00:00            /bin/sh /docker-entrypoint.sh
root     27662   27446   0  07:15  ?    00:00:00            crond -f d8 -l 8
This is displayed the process overview: 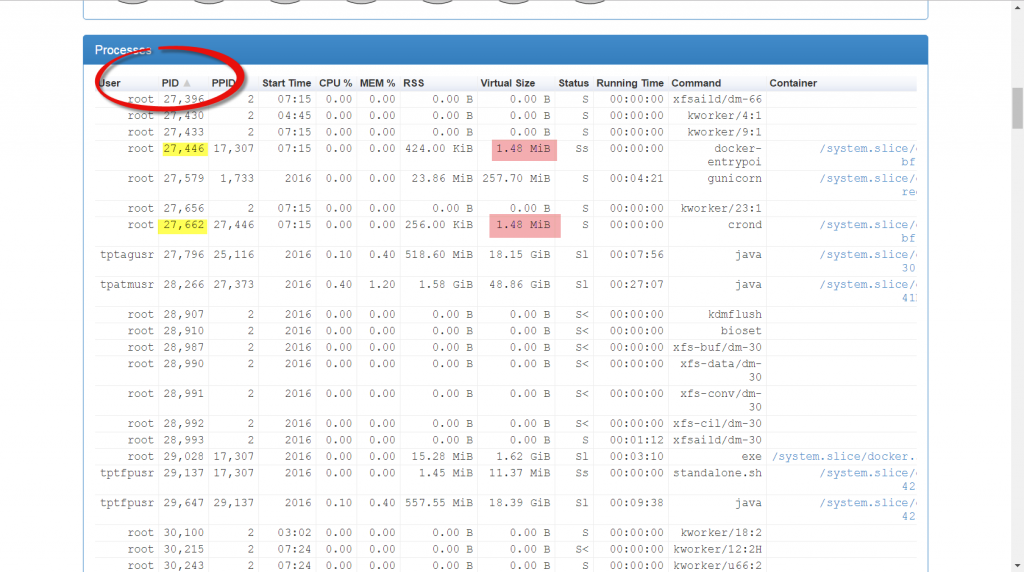
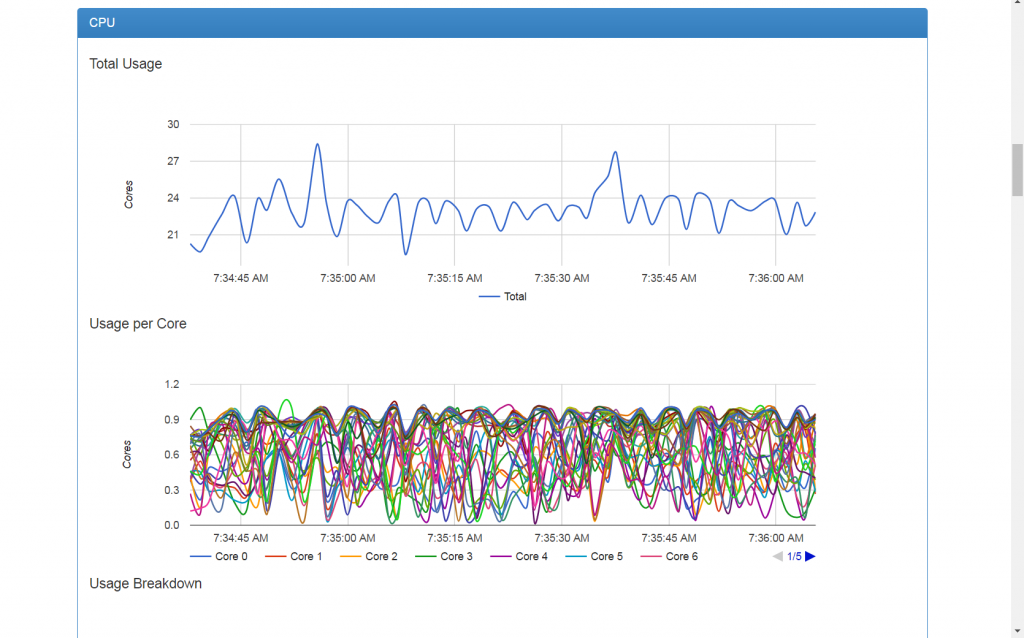
CPU Usage
Having 32 CPUs can be a little bit messy in the diagram ![]() .
. 
Network Usage
You can filter with cAdvisor the respective Interface. 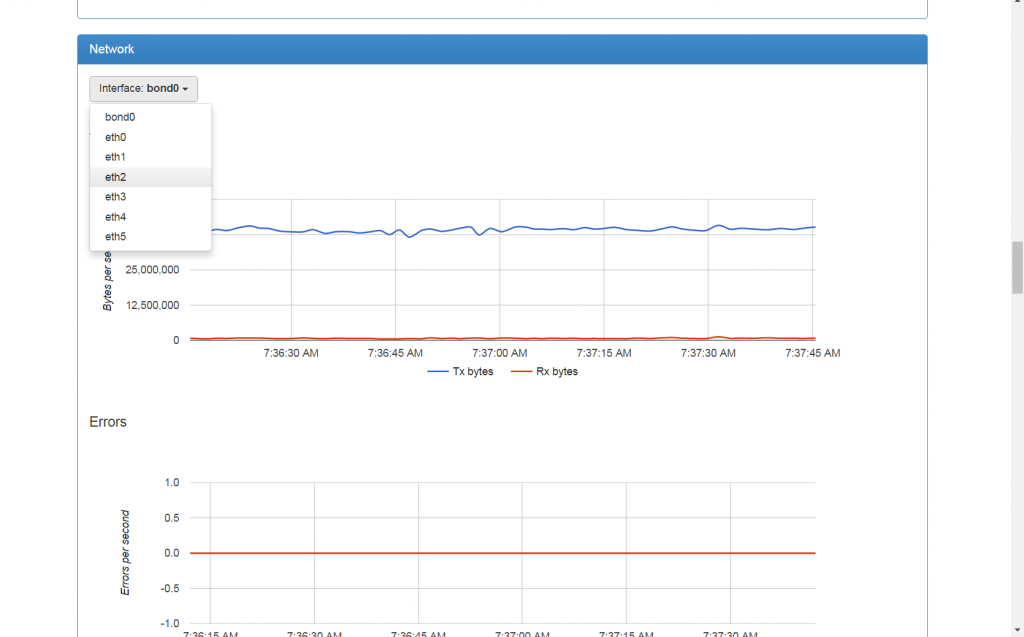
Container Overview
But it much simpler if you open the overview of the desired container ![]() .
.