![]() This post is older than a year. Consider some information might not be accurate anymore.
This post is older than a year. Consider some information might not be accurate anymore. ![]()
Used: elasticsearch v5.6.4 jaegertracing
Distributed Tracing with Jaeger by Uber Technologies is pretty impressive. As default you use Apache Cassandra as storage. Jaeger is also capable of using Elasticsearch 5/6. It took me some time and some code diving on github to find the respective options for Elasticsearch. But I finally got it together in this docker-compose.yml. My Elasticsearch Cluster runs with a commercial X-Pack license so we have to pass some authentication.
Jaeger Components
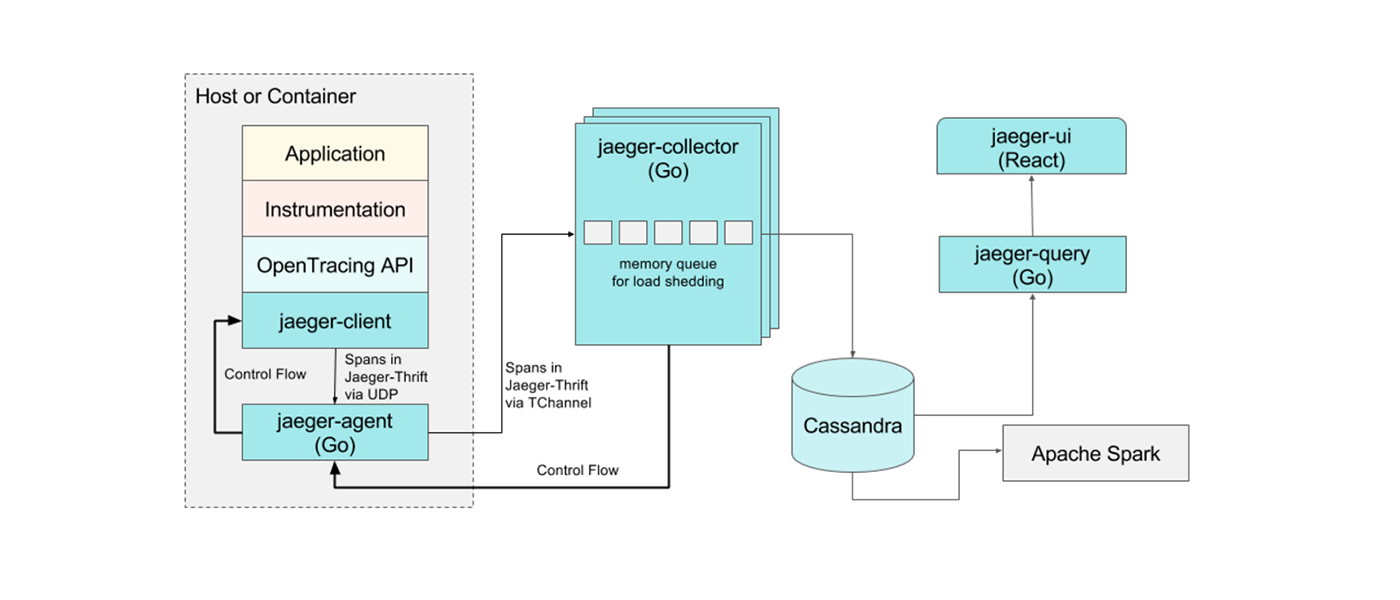
This image from Uber Technologies illustrates the components:

- Agent = The agent is a daemon program that runs on every host and receives tracing information submitted by applications via Jaeger client libraries.
- Collector = The agent sends the traces to the collector which is responsible to write into the storage (default Cassandra). In our case it is Elasticsearch.
- Query = Query is a service that retrieves traces from storage and hosts a UI to display them.
Elasticsearch Options
Since the Collector and the Query access Elasticsearch as storage, I found respective configuration options in the options.go. In detail:
-
es.server-urls= A list of servers or simplify it with a load balancer address. -
es.username= If you have secured Elasticsearch with X-Pack Security or Basic Auth Proxy. -
es.password= The credential for the respective user. -
es.num-shards= Creates new index with given number of shards.
Docker Compose
version: "3"

services:
  collector:
    image: jaegertracing/jaeger-collector
    environment:
      - SPAN_STORAGE_TYPE=elasticsearch
    ports:
      - "14269"
      - "14268:14268"
      - "14267"
      - "9411:9411"
    restart: on-failure
    command: ["/go/bin/collector-linux", "--es.server-urls=http://es-loadbalancer:9200", "--es.username=jaeger_remote_agent", "--es.password=HunterSpir!t", "--es.num-shards=1", "--span-storage.type=elasticsearch", "--log-level=error"]

  agent:
    image: jaegertracing/jaeger-agent
    environment:
      - SPAN_STORAGE_TYPE=elasticsearch
    command: ["/go/bin/agent-linux", "--collector.host-port=collector:14267"]
    ports:
      - "5775:5775/udp"
      - "6831:6831/udp"
      - "6832:6832/udp"
      - "5778:5778"
    restart: on-failure
    depends_on:
      - collector

  query:
    image: jaegertracing/jaeger-query
    environment:
      - SPAN_STORAGE_TYPE=elasticsearch
      - no_proxy=localhost
    ports:
      - "16686:16686"
      - "16687"
    restart: on-failure
    command: ["/go/bin/query-linux", "--es.server-urls=http://es-loadbalancer:9200", "--span-storage.type=elasticsearch", "--log-level=debug", "--es.username=jaeger_remote_agent", "--es.password=HunterSpir!t", "--query.static-files=/go/jaeger-ui/"]
    depends_on:
      - agent
You could easily just ramp up elasticsearch in above docker-compose file.
If you do docker-compose up all services are nicely started.
Starting collector_1 ... done
Starting agent_1 ... done
Starting query_1 ... done
Attaching to collector_1, agent_1, query_1
agent_1      | {"level":"info","ts":1517582471.4691374,"caller":"tchannel/builder.go:89","msg":"Enabling service discovery","service":"jaeger-collector"}
agent_1      | {"level":"info","ts":1517582471.4693034,"caller":"peerlistmgr/peer_list_mgr.go:111","msg":"Registering active peer","peer":"collector:14267"}
agent_1      | {"level":"info","ts":1517582471.4709918,"caller":"agent/main.go:64","msg":"Starting agent"}
query_1      | {"level":"info","ts":1517582471.871992,"caller":"healthcheck/handler.go:99","msg":"Health Check server started","http-port":16687,"status":"unavailable"}
query_1      | {"level":"info","ts":1517582471.9079432,"caller":"query/main.go:126","msg":"Registering metrics handler with HTTP server","route":"/metrics"}
query_1      | {"level":"info","ts":1517582471.908044,"caller":"healthcheck/handler.go:133","msg":"Health Check state change","status":"ready"}
query_1      | {"level":"info","ts":1517582471.9086466,"caller":"query/main.go:135","msg":"Starting jaeger-query HTTP server","port":16686}
agent_1      | {"level":"info","ts":1517582472.472438,"caller":"peerlistmgr/peer_list_mgr.go:157","msg":"Not enough connected peers","connected":0,"required":1}
agent_1      | {"level":"info","ts":1517582472.4725628,"caller":"peerlistmgr/peer_list_mgr.go:166","msg":"Trying to connect to peer","host:port":"collector:14267"}
agent_1      | {"level":"info","ts":1517582472.4746702,"caller":"peerlistmgr/peer_list_mgr.go:176","msg":"Connected to peer","host:port":"[::]:14267"}
Dependencies
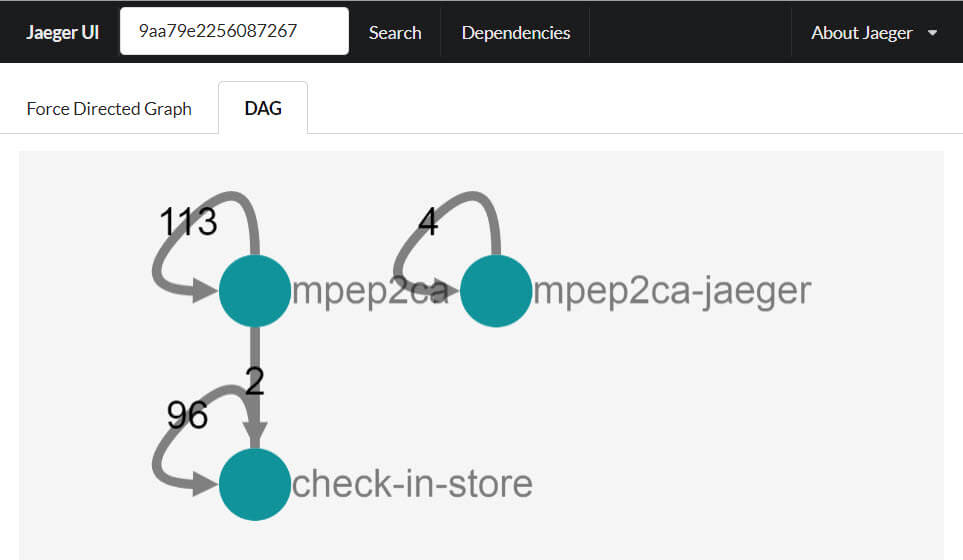
Jaeger has the amazing feature to draw the dependency diagram for your traces.

If you want to have this amazing feature in a productive setup you need to start the spark-dependencies. Apache Spark is fast engine for large scale data processing, which the collection of spans are. I was a little bit afraid that Elasticsearch wasn’t supported, but luckily I was mistaken. The options are very well documented. A basic template for starting the spark-dependencies as docker container with Elasticsearch as storage backend:
docker run \
--env STORAGE=elasticsearch \
--env ES_NODES=http://elasticsearch-server1:9200,http://elasticsearch-server2:9200 \
--env ES_USERNAME=elastic \
--env ES_PASSWORD=IHaveChangedMyPassword \
jaegertracing/spark-dependencies
This has resulted in
tan@omega3:~> docker run --env STORAGE=elasticsearch --env ES_NODES=http://elastic-lb:9200 --env ES_USERNAME=elastic --env ES_PASSWORD=IHaveChangedMyPassword jaegertracing/spark-dependencies

18/02/08 10:50:49 INFO ElasticsearchDependenciesJob: Running Dependencies job for 2018-02-08T00:00Z, reading from jaeger-span-2018-02-08 index, result storing to jaeger-dependencies-2018-02-08/dependencies
18/02/08 10:50:50 WARN NativeCodeLoader: Unable to load native-hadoop library for your platform... using builtin-java classes where applicable
18/02/08 10:50:55 INFO ElasticsearchDependenciesJob: Done, 4 dependency objects created
In order to keep the dependencies up to date, we need some kind of scheduler. There are several possibilities as cron job or having the luxury of a cluster manager, would also suffice.
