![]() This post is older than a year. Consider some information might not be accurate anymore.
This post is older than a year. Consider some information might not be accurate anymore. ![]()
Used: apache kafka v1.0.0 kafka-manager v1.3.3.16
Monitoring for Apache Kafka is crucial to know the moment when to act or scale out your Kafka clusters. Besides the CLI commands, metrics are also accessible over JMX and jconsole. A more convenient way is to have a GUI that displays it. This post focus on Kafka Manager, a administration GUI for Kafka by Yahoo.
Other solutions like elasticsearch and metricbeat kafka module by elastic also exists, but the module itself is beta and subject to change. Therefore I discard the idea using Kibana and Elasticsearch.
Enable JMX
JMX must be enabled in order to get them displayed in kafka-manager.
In my ansible playbook.yml for the Apache Kafka Docker container, add these environment variables.
KAFKA_JMX_OPTS: "-Dcom.sun.management.jmxremote \
  -Dcom.sun.management.jmxremote.authenticate=false \
  -Dcom.sun.management.jmxremote.ssl=false \
  -Djava.rmi.server.hostname={{ansible_hostname}} \
  -Dcom.sun.management.jmxremote.rmi.port=9099"
JMX_PORT: 9099
Pay attention to the exposed JMX port. You can choose any port. I think port 9099 is fitting, as the default exposed port is 9092.
Kafka Manager
If Apache ZooKeeper and Apache Kafka is operational I start a separate docker container for kafka-manager. The most recent docker image for kafka-manager is by sheepkiller.
Run interactive, adjust the ZK_HOSTS to your needs.
docker run -it --rm -p 9000:9000 \
-e ZK_HOSTS="alpha:2181,beta:2181,gamma:2181" \
sheepkiller/kafka-manager -Djava.net.preferIPv4Stack=true
Or run detached for production mode
docker run -d --name kafka-manager -p 9000:9000 \
-e ZK_HOSTS="alpha:2181,beta:2181,gamma:2181" \
--restart always \
--log-driver json-file --log-opt max-size=10m \
sheepkiller/kafka-manager -Djava.net.preferIPv4Stack=true
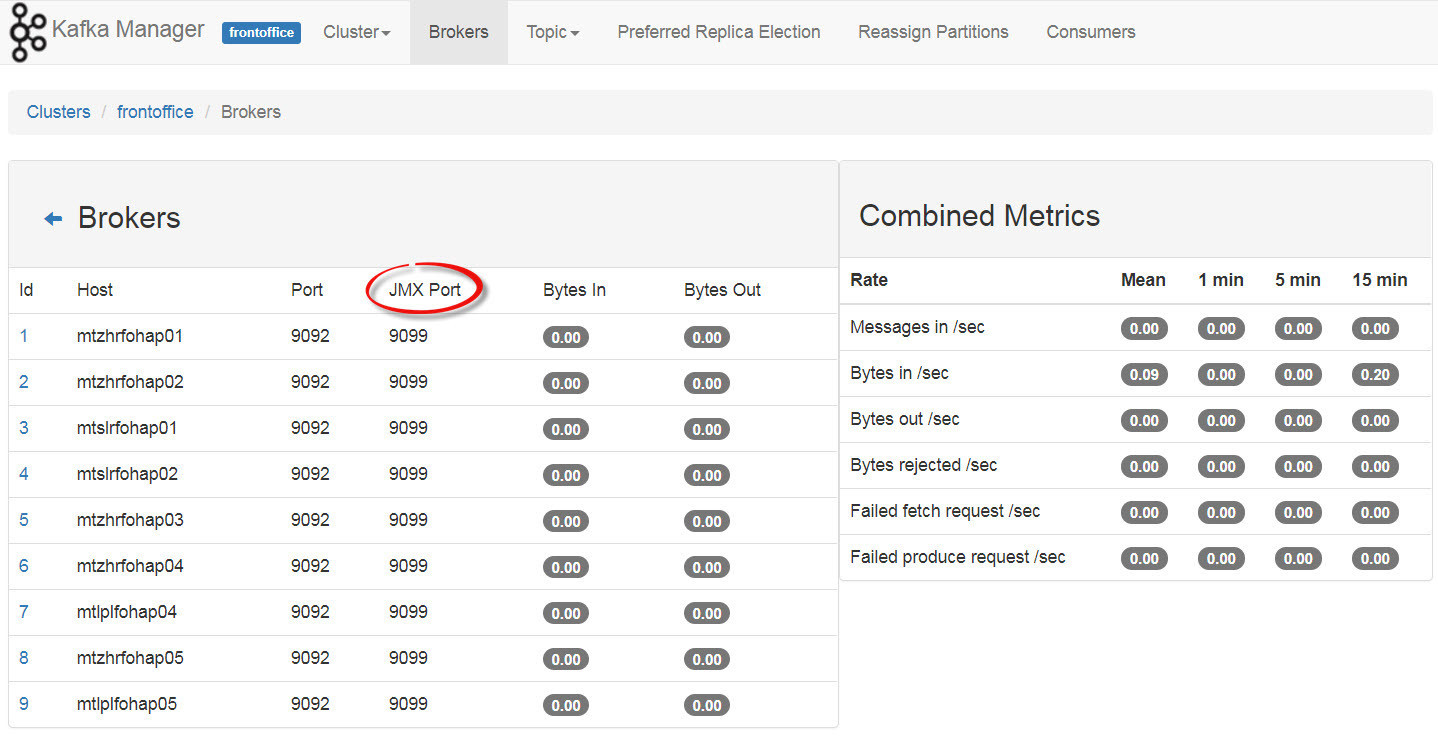
You can access the GUI on the docker host over port 9000. See below exposed metrics.

